Milton Just Posted the Fastest Pace in Halton — Here’s What It Means If You’re Selling
Saturday Jun 27th, 2026
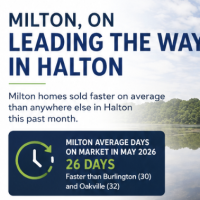
The May 2026 numbers are in from the Toronto Regional Real Estate Board, and there's a story in here that Milton sellers should know: of the four municipalities in Halton Region, Milton homes sold faster on average than anywhere else this past month.
That's not a small thing. It's the kind of stat that tells you something concrete about timing — not just “the market is good,” but specifically what's happening in your town right now compared to the towns/cities around it.
How Milton Stacked Up Against the Rest of Halton in May
Here's how the four Halton municipalities compared, all home types, May 2026:
|
Municipality |
Sales |
Average Price |
Avg. Sale-to-List |
Avg. Days on Market |
|
Halton Hills |
69 |
$1,018,074 |
98% |
22 |
|
Milton |
165 |
$977,732 |
98% |
26 |
|
Burlington |
278 |
$1,126,148 |
98% |
30 |
|
Oakville |
304 |
$1,559,052 |
96% |
32 |
Milton moved homes in 26 days on average — faster than Burlington's 30 and Oakville's 32, and only just behind Halton Hills' 22. At the same time, Milton's average sale price ($977,732) was the most accessible of the four towns, with a 98% average sale-to-list ratio that matched the region's strongest performers.
Put simply: Milton is selling almost as fast as anywhere in Halton, at a price point that's actually drawing buyers in.
What's Happening Inside Milton's Own Numbers
Zooming into Milton specifically for May 2026:
165 sales totaling $161.3 million in volume
Average price $977,732, median $885,000
98% average sale-to-list ratio — meaning homes are selling very close to their asking price, town-wide
26 days on market average
By home type, a few segments stood out:
Attached/row/townhouses were both the busiest segment and the fastest: 48 sales, a 99% sale-to-list ratio, and just 23 days on market — the quickest-moving category in Milton this month.
Semi-detached homes matched that strength on price, posting a 100% average sale-to-list ratio — meaning, on average, semis sold right at asking, with the same 25-day pace as detached homes.
Detached homes remained the largest dollar-volume category: 77 sales, $1.23 million average price, 98% sale-to-list, 25 days on market.
Condo apartments and condo townhouses moved more slowly — 39 and 42 days on market respectively — a reminder that even in a fast-moving month, pace still depends heavily on property type.
The Bigger Picture: Year-to-Date
Looking at the full picture so far in 2026 (January through May), Milton has logged 565 sales worth $555.2 million, at a 98% average sale-to-list ratio and a 30-day average market time. That's a slightly longer year-to-date pace than the single-month May snapshot, which suggests the spring market has been picking up speed as it's progressed — May moved faster than the year's average so far.
What This Means If You're Thinking of Selling
Milton's pace is a genuine selling point right now. Being the fastest-moving of the four Halton municipalities (apart from Halton Hills, which is close behind it) isn't just a bragging-rights stat — it tells prospective sellers that demand is currently outpacing what a lot of national “slowing market” narratives would suggest.
Pricing at or near market value continues to be what's working. A 98% average sale-to-list ratio town-wide means the homes selling fastest are the ones priced to reflect what buyers are actually willing to pay — not the ones testing the market with an inflated number.
Property type still drives your timeline more than the headline number does. If you own an attached/row/townhouse or a semi-detached home, this month's data says you're in the fastest-moving, best-priced segment of the market. If you own a condo, expect a longer runway and plan your move accordingly.
The Bottom Line
“Milton is hot right now” isn't just a sales pitch this month — it's backed by the numbers, especially compared to its closest neighbors in Halton. But how that translates to your specific home depends on your property type and your price point, not the town-wide average alone.
Want to know exactly where your home fits in this market? Reach out for a free, no-obligation market snapshot for your home type and price range — pulled directly from this month's official TRREB data.
Source: Toronto Regional Real Estate Board, Regional Housing Market Report, Halton, May 2026. Figures reflect firm transactions and active listings as reported for the month of May 2026 and year-to-date 2026.